Beaconchain Dashboard
- 4.7
- Rating
- 10.00K
- Installs
- Free
- Price
 Analysis by App-foxy
I approached Beaconchain Dashboard as a focused companion for people who operate or monitor Ethereum and Gnosis validators, rather than as a general-purpose finance app. That distinction matters immediately. If you want a wallet, a portfolio tracker, or a place to buy and sell tokens, this is not the tool I would start with. Its value is narrower and more practical: it gives validator operators a convenient way to keep an eye on the state of their infrastructure without treating a phone as a replacement for the underlying validator setup.
In my experience, the app makes the most sense when you already understand the basics of staking and know which validator information you need to follow. The interface is aimed at checking status, not teaching Ethereum from scratch. I found that refreshing the right view can answer a quick question during a busy day, while diagnosing a serious problem still requires looking at the validator client, beacon node, host machine, network connection, or the relevant explorer in more detail.
That focused role is also why the app has earned a 4.7 average from around 354 ratings and passed the 10K+ install mark. Those figures suggest a small but clearly interested audience, not a mass-market finance crowd. The developer is bitfly explorer gmbh, the app is free to install, and it is rated for Everyone. There are in-app purchases ranging from $10.99 to $499.99 per item, so I would still check the purchase screen carefully before assuming every part of the experience is included at no cost.
You May Also Like

 Blood Strike: 2.5 Anniversary
Blood Strike’s Loadouts Turn Every Drop Into a Tactical Gamble
A close look at Blood Strike’s custom loadouts: how fast access to signature weapons reshapes its battle royale rhythm, rewards preparation, and narrows the gap between fights.

 Pandora - Music & Podcasts
Pandora’s Music Is Easy to Start, but Harder to Recover
Pandora’s strength is its low-effort path from a seed to a station. Its weak spot is how much confidence it asks you to place in connection, setup, and quiet recovery.

 8 Ball Pool
 Is Built on Rivalries, Rematches, and Routine
A close look at the rivalries, rematches, shared routines, and unanswered safety questions that turn a quick pool match into a persistent mobile community.

 Samsung Music
’s Quiet Strength Is Playing What You Already Own
Its reach comes less from spectacle than from dependable access to a personal library. That simplicity is both the app’s strongest retention engine and its ceiling.

 AccuWeather: Weather Radar
AccuWeather Review: A Quick, Clear Forecast for Everyday Decisions
For everyday plans, the best forecast is the one you can understand quickly. AccuWeather makes rain timing, radar, and local conditions easy to act on, with a few trade-offs.

 Hill Climb Racing
Why Hill Climb Racing Still Turns Crashes Into One More Run
A tiny car, a bumpy hill and one more upgrade: Hill Climb Racing keeps resurfacing because its simple chaos makes every near-miss feel personal.
More From Our News Desk
View All News


Where the first checks usually become confusing
The biggest source of friction is not necessarily the dashboard itself. It is the difference between an app showing public validator information and the equipment that actually runs a validator. A phone dashboard can report what the network or explorer knows, but it cannot repair a stopped validator client, restore a disconnected beacon node, or correct a problem on the machine hosting the keys. I kept that distinction in mind throughout testing because it prevents a lot of wasted troubleshooting.
A validator may appear inactive for several different reasons. The underlying machine could be offline, the node may have lost its network connection, the client could be delayed, or the public information may simply take time to reflect a recent change. The useful first question is therefore not “why is the app broken?” but “is the same condition visible from another reliable place?” If the validator client and node are healthy while the dashboard looks stale, the issue may be refresh timing or data delivery rather than validator performance.
Another common stumbling block is looking at the wrong network. Beaconchain Dashboard is designed around Ethereum and Gnosis validators, so I would first confirm that the validator belongs to the network currently selected or displayed. Ethereum and Gnosis are related ecosystems, but they are not interchangeable views. A perfectly healthy validator can look missing or irrelevant if I search in the wrong context.
Search details also deserve care. A validator identifier, a deposit address, and a wallet address are not automatically the same thing in the way a new user might expect. When checking a validator, I would copy the identifier directly from the source where I manage it instead of typing a long string by hand. That small habit avoids confusing a typo with a synchronization problem and is especially useful when several validators are being watched together.
What I check before blaming the dashboard
My first pass is deliberately simple. I confirm the phone has a working connection, close and reopen the app, and try the lookup again after checking that I am using the intended network and identifier. I also compare the result with the validator’s own monitoring source or the explorer view I normally trust. This is basic, but it separates a local display issue from a real operational incident.
I would not repeatedly reinstall the app as a first response. Reinstallation can remove local preferences or make me repeat setup without addressing a remote data delay. It is more useful to record what is visible, note when the status changed, and then inspect the validator host. If the host is unreachable, checking the phone again will not solve the underlying fault.
The app runs on Android starting with version 6.0, which makes it accessible on many older devices. That broad compatibility is convenient, although an older phone may still have its own battery, background-refresh, or network restrictions. I would avoid assuming that a notification or update failed solely because of the app until I have checked the phone’s system settings and whether the device allows the app to work normally in the background.
A setup routine that saves time later
My preferred setup is to begin with one known validator rather than importing or checking everything at once. I verify that the first result matches the validator information I already recognize, then add the rest in a controlled order. This creates a reference point. If later entries look wrong, I can compare them with the first successful lookup instead of trying to troubleshoot several unknowns simultaneously.
I also keep a private record of which validators I intend to monitor and which network each belongs to. That is not a glamorous feature, but it reduces mistakes when an operator has both Ethereum and Gnosis activity. A dashboard is only as useful as the identifiers supplied to it, and a clean personal naming system makes an unfamiliar status much easier to interpret.
Because this is a monitoring tool, I would not treat the initial display as proof that a validator is fully operational. After setup, I wait for information to settle and compare the result with the system that actually runs the validator. The dashboard is strongest as a second pair of eyes: quick for checking, but not the sole authority for maintenance decisions.
There is also a practical privacy habit worth adopting. I avoid sharing screenshots that expose more validator or wallet information than necessary, especially in public support discussions. A screenshot can be useful for explaining a display problem, but it should be cropped to the relevant status and checked for identifiers before posting anywhere. The app’s convenience should not encourage careless disclosure of operational details.
Recovering a workflow when information looks wrong
When a status appears stuck, I use a layered recovery process instead of tapping refresh endlessly. First, I check whether the phone itself is online. Next, I confirm the selected network and identifier. Then I compare the dashboard with the validator software or another explorer. Finally, I allow enough time for a recent change to become visible. Each step answers a different question, and skipping straight to reinstalling usually gives me less information.
A useful example is a validator operator who receives a concern while away from home. The operator opens the dashboard and sees an unexpected status, but the phone is connected through an unreliable public network. I would take a screenshot or note the status, switch to a dependable connection, reopen the relevant validator view, and compare it with the monitoring output from the staking machine. If both sources show trouble, the next action belongs on the host or node. If only the phone view is unusual, I would treat it as a display or data-timing issue until confirmed.
This workflow also helps with recent maintenance. If a node has just restarted, a dashboard may not immediately present the situation in the way I expect. I avoid making a second configuration change simply because the phone view has not caught up. Instead, I check the local service logs or management interface on the validator machine, confirm that the node is syncing or participating as intended, and then return to the dashboard for a later verification.
The same caution applies after changing networks or monitoring a new validator. I make one change at a time, confirm the result, and record what happened. That method is slower than experimenting randomly, but it is much easier to reverse. It also prevents a common mistake: assuming that a missing result means a validator has been removed or lost when the real problem is an incorrect identifier.
What the app is good at, and what it cannot replace
The strongest use case is quick remote awareness. I can imagine opening it during a commute, before going to sleep, or while checking several systems during routine maintenance. It is especially useful for an operator who does not want to open a desktop explorer every time a simple status question comes up. The narrow scope becomes an advantage because the app is centered on validators rather than burying the relevant information inside a broad investment dashboard.
It is less suitable for someone who wants a complete financial picture. A typical wallet or portfolio application is better for balances, token holdings, transactions, and market activity. A full staking management environment is better for configuration, logs, key handling, client updates, and recovery procedures. Beaconchain Dashboard sits between those worlds as a monitoring-oriented view, so I would use it alongside those tools rather than expecting it to replace them.
I would also skip it if I am only curious about cryptocurrency prices. The app’s purpose is tied to Ethereum and Gnosis validator tracking, not casual market watching. Likewise, a person who has never encountered validator concepts may find the information too specialized without first learning what the displayed states mean. The Everyone age rating describes accessibility, but it does not turn a technical staking dashboard into a beginner course.
One trade-off I noticed is that a concentrated dashboard can encourage overchecking. Validator operators may feel tempted to refresh repeatedly whenever a status does not change instantly. That habit adds anxiety without improving reliability. I get more value by checking at sensible moments and using the underlying node tools when a real operational decision is required.
When the problem is outside the app
There are several situations where troubleshooting the phone is the wrong priority. If the validator host has lost power, if the beacon node is not synchronized, if the network connection is unstable, or if the validator client is reporting errors, the dashboard is only showing the consequence. In those cases I would work from the machine running the validator outward, checking services, connectivity, and logs according to the setup I already use.
Account and identifier mistakes are another external cause. A dashboard cannot infer which validator I meant if I supplied a similar-looking address or selected the wrong network. I would copy the identifier again from a trusted source, compare every character, and make sure the entry corresponds to a validator rather than a wallet. This is one of the most effective fixes because it addresses the input rather than the display.
Temporary network or service delays should also be handled patiently. If an independent source shows the validator behaving normally, I avoid making changes to keys, clients, or node settings based only on a short-lived dashboard discrepancy. I would retry later, keep the original observation for comparison, and escalate only if the mismatch persists across connections and sources.
For more serious incidents, I prefer the app as an alerting clue rather than a diagnostic console. It can tell me where to look, but the validator environment tells me what to do. That boundary is important for safety: no mobile status screen should encourage rushed changes to staking infrastructure, especially when the operator has not confirmed the source of the problem.
My practical verdict for Ethereum and Gnosis operators
After using it as a focused monitoring companion, I see Beaconchain Dashboard as a sensible choice for a specific audience: people who already operate or follow Ethereum and Gnosis validators and want a convenient mobile check. Its free entry point lowers the barrier to trying it, while the 4.5.34 release shows that the app remains an actively presented product rather than an abandoned listing. I would still review any optional purchase carefully, since the available in-app items can reach several hundred dollars.
The app’s real strength is not breadth. It is the ability to keep validator awareness close at hand without opening a desktop workflow for every quick check. The most valuable habit is using it as part of a layered process: confirm the network, verify the identifier, compare with the validator’s own environment, and only then decide whether action is needed. That approach turns a potentially confusing status screen into a useful operational shortcut.
My recommendation is therefore conditional but positive. If I were advising a validator operator who wants a mobile dashboard for Ethereum or Gnosis, I would suggest trying it, beginning with one known validator and treating the first result as a verification exercise. I would not recommend relying on it alone for repairs, key management, or final incident diagnosis. A desktop explorer may be better for detailed investigation, while a wallet or portfolio app will suit ordinary asset tracking.
The practical takeaway is simple: use Beaconchain Dashboard to notice a question quickly, not to pretend the question has already been solved. With that expectation, its focused design becomes useful rather than limiting. It gives me a fast view for everyday checks, while leaving the technically important work where it belongs: in the validator client, beacon node, host machine, and carefully verified network information.
FAQs for Beaconchain Dashboard
01What is Beaconchain Dashboard used for?
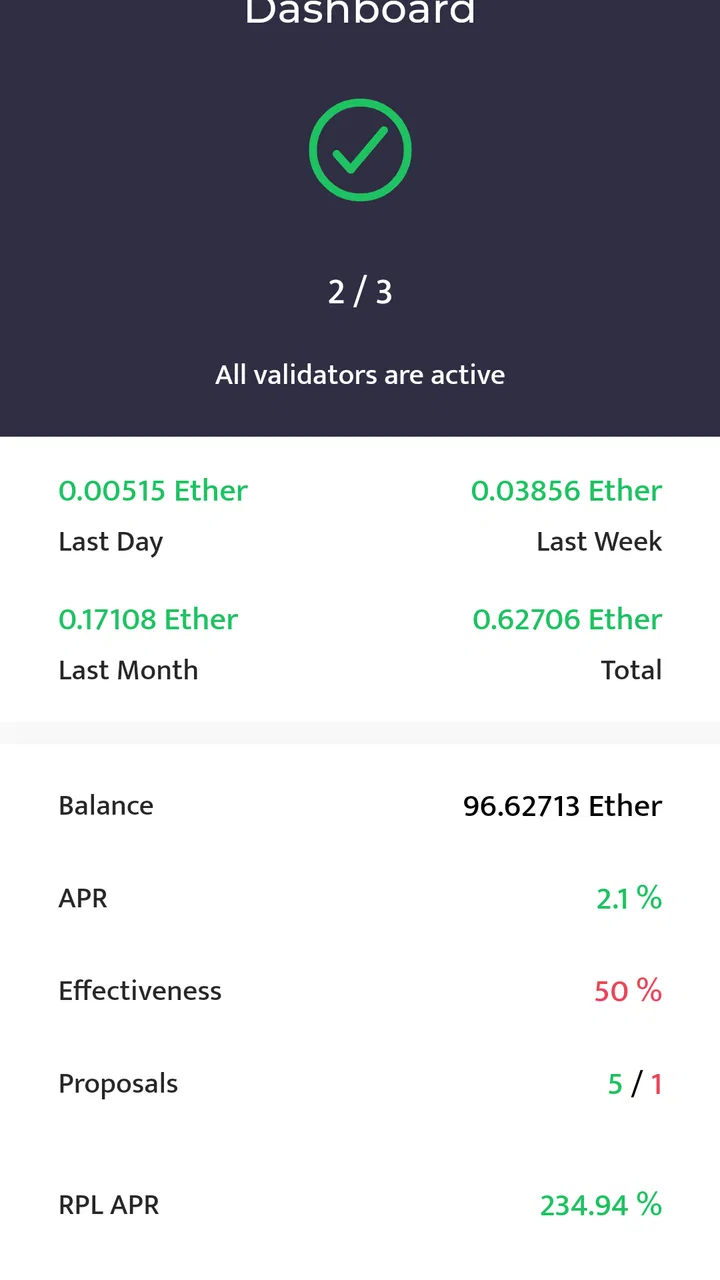
Beaconchain Dashboard is a monitoring and analytics tool for Ethereum proof-of-stake validators. It presents information such as validator balances, effectiveness, attestations, proposals, missed duties, rewards, penalties, and participation history in a more organized format. It is mainly useful for stakers who want to check validator performance without relying only on raw blockchain data or navigating several separate pages.
02Can Beaconchain Dashboard monitor my Ethereum validator in real time?
The dashboard can display frequently updated validator information, but it should not be treated as an instant, second-by-second monitoring system. Data depends on blockchain activity, indexing, network conditions, and the service’s own update schedule. Small delays are normal, especially during busy periods or maintenance. For critical operations, users should also verify information through their validator client, node logs, and official Ethereum network resources.
03Do I need to connect my wallet or share validator keys to use it?
For basic validator monitoring, you generally only need a public validator index, public address, or another publicly available identifier. A dashboard should never require your validator signing keys, withdrawal credentials, seed phrase, or private wallet password. These details must remain offline and confidential. If an app or website asks for sensitive credentials merely to show performance statistics, stop and verify that you are using the legitimate service.
04Can Beaconchain Dashboard show rewards, penalties, and validator problems?
One of its most useful purposes is helping users understand validator activity over time. Depending on the available data and the selected validator, it may show attestation performance, missed duties, proposals, balance changes, rewards, penalties, and effectiveness percentages. However, displayed figures can differ from wallet balances or accounting platforms because rewards may be calculated, estimated, or indexed differently. Always review the underlying transactions and validator records before making financial decisions.
05Is Beaconchain Dashboard suitable for beginners, and what should I know before downloading it?
The dashboard can be helpful for beginners because it gathers technical validator information into charts, summaries, and readable performance indicators. Nevertheless, some terms—such as attestations, epochs, effectiveness, inactivity leaks, and consensus-layer rewards—still require basic Ethereum knowledge. Before downloading, check whether the version supports your device, review requested permissions, confirm the developer or official source, and remember that analytics apps do not replace secure validator maintenance or backup procedures.
Pros
- Clear Ethereum validator and network statistics in one place.
- Useful charts for tracking staking performance and validator health.
- Helps identify missed attestations and possible validator issues.
- Supports informed monitoring without needing to run a full node.
- Clean dashboard layout makes key metrics easy to find.
Cons
- Advanced staking metrics may be confusing for newcomers.
- Some data can be delayed or temporarily unavailable.
- Limited value if you do not operate or follow Ethereum validators.
- Requires an internet connection for current network information.
- Mobile users may find dense charts difficult to read on smaller screens.

Beaconchain Dashboard
Gallery